Monitoring Nodes
This guide covers monitoring your nodes, including status tracking and performance metrics.
Overview
Monitor your nodes to ensure optimal performance and maximize earnings:
- Status Monitoring: Track node health and availability
- Performance Metrics: Monitor key performance indicators
- Grafana Integration: Access detailed logs and dashboards
Node Status Monitoring
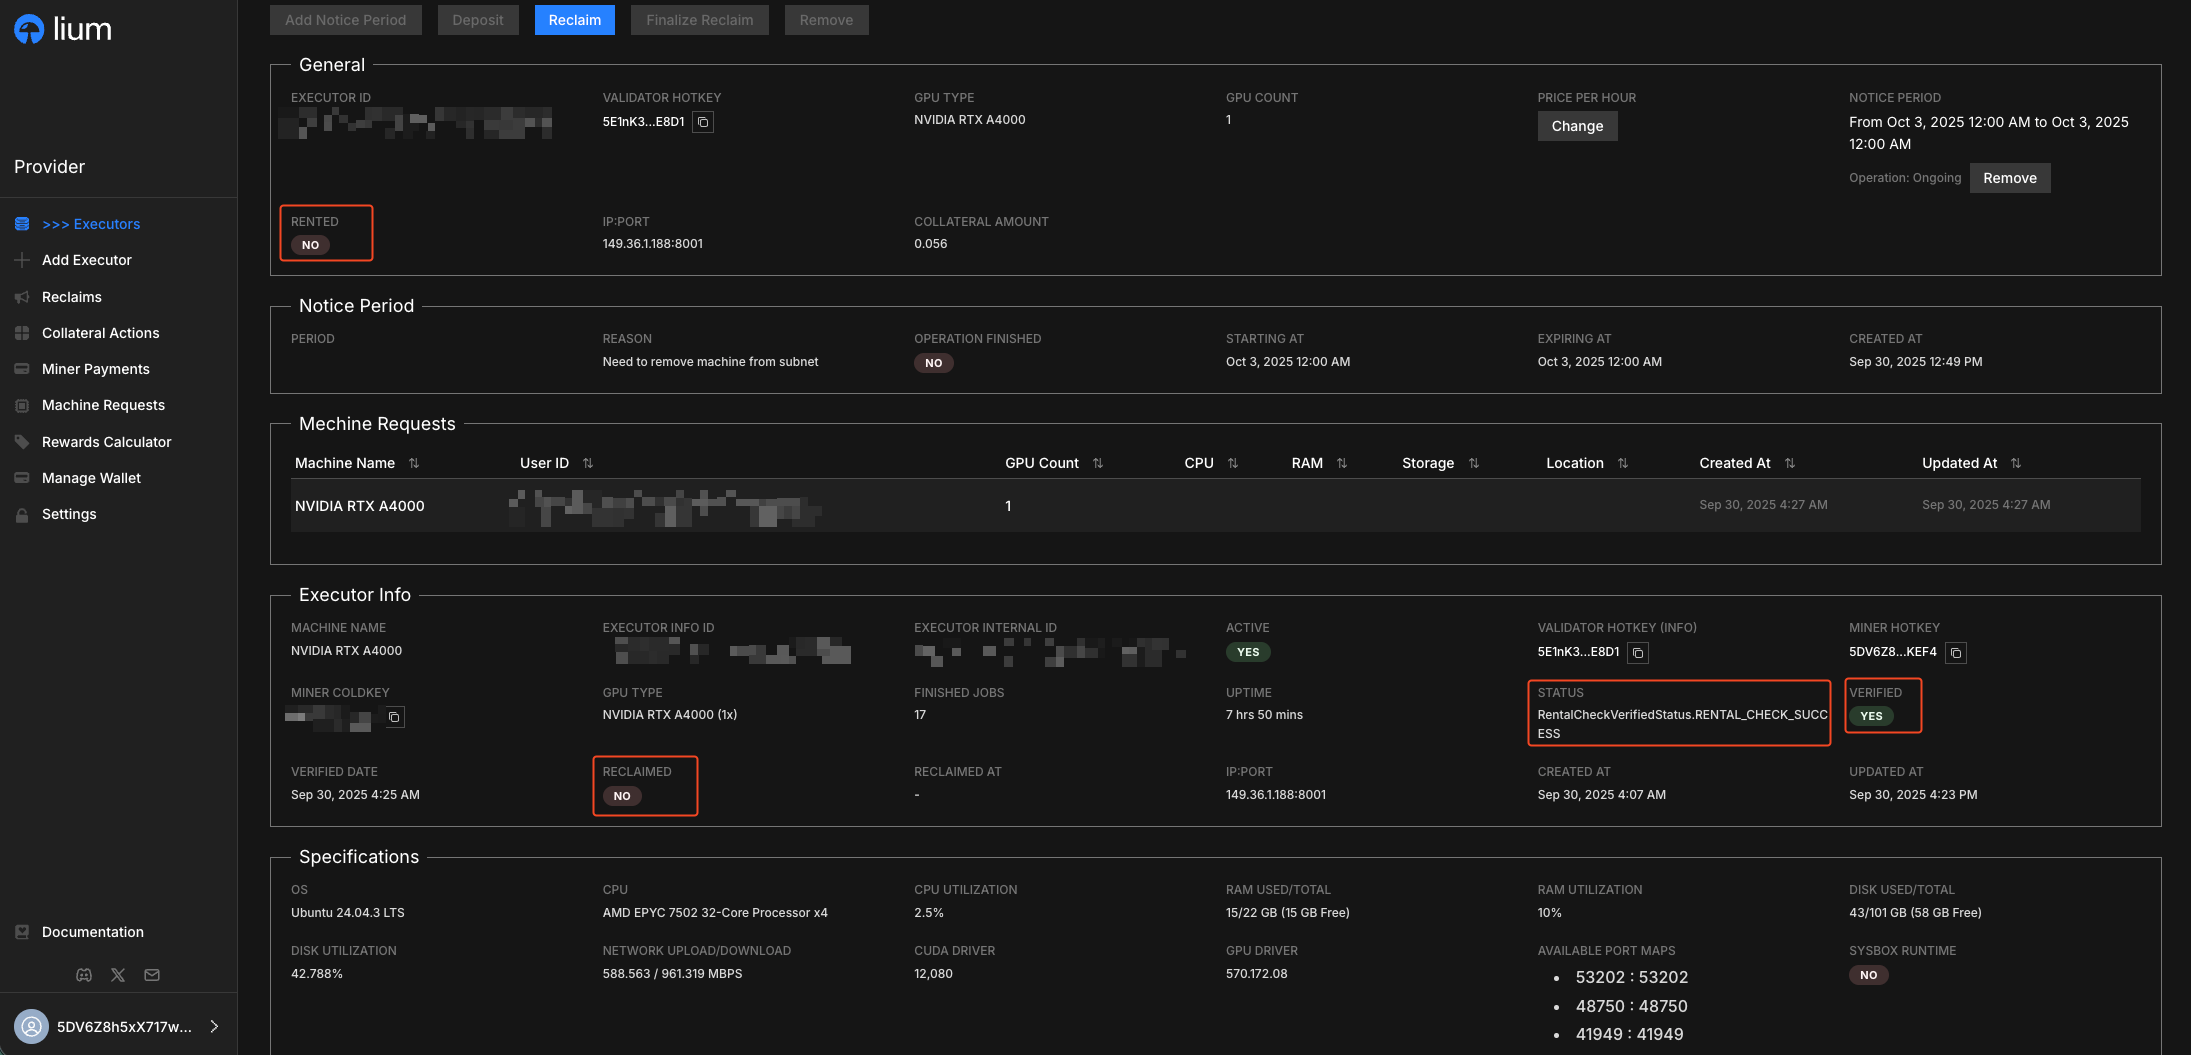
The Status badge on the Nodes list and at the top of each node's detail page is computed by the portal from three inputs: the backend's ping of the node's service port (every 5 minutes, 10-second timeout), whether the validator currently lists the node as active, and the validator's most recent log line for the node (looked up over the last 2 hours). Hover the badge for the one-line reason. The same status and message come back as computed_status from GET /executors and GET /executors/{id} on the portal API.
What each status means
| Badge | Portal message | What it means | What to do |
|---|---|---|---|
| AVAILABLE | N of M GPUs ready for rent | Validated, listed, rentable. | Nothing. |
| RENTED | All M GPUs are currently rented | Every GPU is under a rental. | Nothing. |
| VALIDATION PENDING | Waiting for first validation from validator (usually within 15 min) | The node was added less than 30 minutes ago and no validator has reported on it yet. A miner-level log from the same window (the miner-level VALIDATION PENDING row below) is not a report on this node, so it does not replace this line. | Wait. Over the 175 nodes added in the 30 days to 6 Sep 2026, Add Node → AVAILABLE took 21 minutes at the median and 64 minutes at the 90th percentile; none was faster than 8 minutes. The wait is one validator cycle (every 15 minutes) plus the validator finishing every provider in that cycle before it publishes. A node that has never been probed at all shows this for 30 minutes, then NOT DETECTED, with no error line in between — the account is not connected to a coordinator; see Troubleshooting. |
| VALIDATION PENDING | Waiting for next validator check | The last verdict passed but the node is not marked active yet — normal right after it recovers from a failure or a restart. | Wait one cycle (≤ 15 minutes). |
| VALIDATION PENDING | one of Miner not answering, Miner reported no nodes, No node accepted the validator's key, Validator's SSH key was not accepted, Validator could not reach this node, Node refused the validator's SSH login, Node failed attestation, Validator could not complete the check — or The last validation check didn't complete. The validator will retry automatically. when the row matches none of them | The newest log line is not a verdict about this node but a problem at the miner level, and the portal reads it against your Central Miner Server switch. Switch ON: the validator talks to Lium's miner for your account — Miner not answering means Lium's miner did not reply within 30 s (nothing on your side); No node accepted the validator's key means Lium's miner asked the nodes of yours that this validator checks to accept its SSH key and none answered on its executor port within 10 s — a fleet whose executor containers are all stopped looks to the validator like a miner with no nodes. Switch OFF: Miner not answering means the miner your hotkey registered on-chain did not answer; Miner reported no nodes means your own miner answered with an empty list. The other titles: the validator's SSH key could not be installed through the miner, the node's SSH server refused the validator's login, or the check stopped before a verdict (could not connect to the node's SSH or executor port, the node failed TDX attestation, or an error on the validator's side). The red panel under the header names the cause and what to change. These miner-level rows were the largest group of error rows in the validator logs in the week to 6 Sep 2026 (78k rows across 167 provider hotkeys). | Switch ON with No node accepted the validator's key: on each node check that the executor container is running (docker ps), that its executor port answers from the internet and that the executor image is current; a node added in the last 30 s can be missed once. Switch OFF with Miner not answering and no miner of your own: turn the switch on at Profile → Central Miner Server — Lium then runs the miner for you. Self-hosted: confirm your miner process is running and reachable from the internet and that the node is in your miner's own node list. Node refused the validator's SSH login: check that the executor container is the one listening on the node's SSH port. Validator could not reach this node: check that the node's SSH port and executor port answer from the internet. If it persists past one cycle, read the miner-level rows in Job Logs. |
| VALIDATION FAILED | the failing check, e.g. VerifyX validation failed (network speed too slow) (last success: 3 hours ago) | The validator ran its checks and rejected the node. It scores 0 and takes no new rentals until a clean check. | Open the node's detail page: the red last error panel names the check, its Impact, How to fix, and — under Technical details — what the validator measured. Look the reason code up in Validator reason codes. |
| NOT DETECTED | The validator has not checked this node recently. It may have been removed from the miner's node list, or the validator can no longer access it over SSH. | No validator log for this node in the last 2 hours, and the node is older than 30 minutes. | Check that the node is still in lium provider node list; on the host, that docker ps shows the executor container and that the service port and SSH port are reachable from outside. Self-hosted: check the miner process. |
| NOT DETECTED | The validator has not checked this node: your hotkey is not registered on the network, so no validator asks about your nodes. … or … your hotkey is registered but no miner serves it, and Central Miner Server is off, so no validator asks about your nodes. … | Same window as above, and the portal's last read of the network's provider list (refreshed about every 2 minutes) has your hotkey either not registered, or registered with no miner address and Central Miner Server OFF. The validator asks a hotkey only through a miner, so these nodes have not been checked. | Not registered: register the hotkey (Quickstart → Step 1), then turn ON Profile → Central Miner Server or run your own miner. Not serving: turn ON Central Miner Server, or start your miner. The validator picks the node up on the next cycle; nothing on the node changes. |
| OFFLINE | Node not responding to ping. Check that the machine is running and network is accessible. | The backend's POST /ping on the node's service port (the ip:port on the row) failed at two 5-minute checks in a row; one failed check alone does not flip the badge, and the next successful ping flips it back. If many nodes across many providers fail in the same check (more than 10 % of all nodes across several providers, or nodes of 25 or more providers), Lium treats it as a problem with its own network check, not your node: it pings them again and waits up to 10 minutes before it shows any of them OFFLINE. A node can be OFFLINE while its Docker logs look normal — what failed is the service port answering from outside within 10 seconds, not the container. While OFFLINE the node is hidden from renters. The red Offline panel on the node page shows Port unreachable since (the time the backend marked it offline: the second failed check in a row, about 5 minutes after the ping first failed, or up to 10 minutes later under the hold above; "not recorded" for a node that went down before this build was released), Last validator check and Last check passed (when the validator passed it in the last 2 hours; an older pass is not shown). | From a machine outside your network: curl -m 10 -X POST http://IP:PORT/ping -H 'content-type: application/json' -d '{}'. Any HTTP status proves the port is reachable; a timeout is the problem — check the firewall, NAT forwarding, and that the port in neurons/executor/.env is the one registered in the portal. |
| RECLAIMED | Collateral reclaim in progress. Node will be removed after completion | The node carries a collateral-reclaim flag. Collateral is not required today, so a healthy node showing this is stuck on a flag from an earlier reclaim, and every availability query skips it. | If you did not ask to remove the node, open a ticket through the official support flow with the node id; the flag is cleared by hand today. |
| PAUSING NEW RENTALS | New rentals are paused after the current rental ends | You requested a pause while the node is still rented. | Nothing — see Pausing new rentals. |
| NEW RENTALS PAUSED | New rentals are paused for this node | The pause is in force: hidden from renters, no unrented incentive. | Resume New Rentals on the node page when you want it back. |
The Node Info panel further down the detail page still shows the older RENTAL_CHECK_* flag and the Active / Verified booleans the badge is derived from; the badge supersedes them for day-to-day monitoring.
To-do cards
Some reason codes come with a card above the red last error panel: what the problem costs, what to do, and the one command or button. The command has a copy button.
| Card | Where the code comes from | What to do |
|---|---|---|
No idle pay: this node is on Spot (spot_tier) | the latest incentive check | Change Tier to Secure while the node is not rented. A node you set to Spot yourself gets this code only while it is rented or partly rented; idle, it is paid while a Lium Default Job runs on it (see Idle pay on Spot). No card for a demoted account: switching would not help it, and the zero-incentive box says why. |
No idle pay: not enough disk for this much GPU memory (insufficient_disk_for_vram) | the latest incentive check | The card shows the disk, the GPU memory and the target: 1.5 times the GPU memory. docker run --rm alpine df -h / shows the disk Docker sees. Add disk or move Docker to a bigger drive. |
No idle pay: the node software is out of date (outdated_executor_image) | the latest incentive check | Once: cd ~/compute-subnet/neurons/executor && git pull && docker compose pull watchtower && docker compose up -d watchtower, then make sure that executor-executor-runner-1 and executor-watchtower-1 are running (Move the node onto the updater, once). A plain docker compose pull keeps the old updater and, behind a registry mirror, pulls the same old runner tag. |
The node software is out of date (EXECUTOR_IMAGE_OUTDATED) | the latest check | The same command. The card says that every check flags the old software and that, where the image check is enforced, the node scores 0 and earns nothing until it runs the current software (see Troubleshooting). When the latest incentive check withheld idle pay for it, this card is not shown: the No idle pay card is. |
The rented container is not running (POD_NOT_RUNNING) | the latest check | docker start <container> with the name the card shows. If it fails, open a ticket with the output. |
Our GPU check got no answer from the GPU: out of memory (GPU_VERIFY_VRAM_UNAVAILABLE, or from an older validator GPU_VERIFY_FAILED with returned_uuid None and out of memory in stderr) | the latest check | Run nvidia-smi on the host. If it prints Driver/library version mismatch, reboot the host. If it lists processes that use GPU memory and are not a Lium pod or a filler_* default job, stop them. See Out of memory. |
Our GPU check got no answer from the GPU: CUDA cannot start (GPU_VERIFY_CUDA_NOT_READY, or the older GPU_VERIFY_FAILED with system not yet initialized in stderr) | the latest check | systemctl status nvidia-fabricmanager on the host; start the service if it is stopped and wait one check. See CUDA cannot start. |
Our GPU check got no answer from the GPU: no CUDA device in the container (GPU_VERIFY_NO_CUDA_DEVICE) | the latest check | docker exec executor-executor-1 nvidia-smi must list every GPU. See the four fixes. |
Our GPU check got no answer from the GPU, other stderr (older GPU_VERIFY_FAILED with returned_uuid None) | the latest check | Run nvidia-smi on the host. If it prints Driver/library version mismatch, reboot the host. Otherwise match the error line under Technical details in Which GPU check failure is yours. |
An error verdict keeps the red last error panel, and a code with a card also gets the card above it. The outdated-image warning (EXECUTOR_IMAGE_OUTDATED on a node with no error) has no red panel: it shows only its card. The No idle pay cards read the same incentive check as the zero-incentive box, which then leaves their reasons out.
Three zero-incentive reasons apply only to an idle node you set to Spot yourself. They have no card; the node's Incentive history under Earnings shows them for each cycle that paid nothing.
| Reason | What it means | What to do |
|---|---|---|
spot_without_lium_filler | No Lium Default Job runs on the node, so it earns no Spot idle pay. | Leave the node without a Default Job of your own, so Lium can run its own (Default Jobs). Or switch it to Secure. |
spot_no_filler_revenue_for_gpu_config | Lium has no Spot rate for this GPU model and GPU count yet. | Nothing on the node. It is paid once the rate is set, or switch it to Secure. |
spot_no_headroom_at_burn_cap | The unrented pool took the whole emission ceiling this cycle, so nothing was left for Spot idle pay (Subnet emission). | Nothing on the node. It usually changes from cycle to cycle. |
Your node in the public listing
The public listing (the marketplace on lium.io, GET https://lium.io/api/executors and its live feed at wss://lium.io/api/executors/ws) carries the nodes a renter can rent at that moment. A node is in it while all of these hold:
- The validator marks it active and verified, and it is not being reclaimed.
- Every GPU is free, or, on a node with GPU splitting, at least the minimum GPU count is free. A node with GPU Profiling on rents only as a whole host, so it leaves the listing as soon as any one of its GPUs is rented, whatever its splitting minimum.
- No pod on it is starting, rebooting, or stuck after a failed reboot, and it has no Pause New Rentals request.
- It is not OFFLINE (see the OFFLINE row above). A new node joins the listing after its first answered ping.
- The platform reached it at its last check (no availability error).
- Its disk reports at most 90% used and at least 50 GB free.
- It reports at least 3 free open ports.
A fully rented node is out of the listing, so a node missing from the public listing is most often rented. The listing carries no reason for a node that is absent. Your own node's state and reason are on its Status badge and last error panel, in lium provider node list (a Status column per node) and lium provider node get <NODE_ID> (status and last error), and in computed_status from the portal API.
The last error panel
When the badge is VALIDATION FAILED, OFFLINE, or VALIDATION PENDING with a miner-level cause, the node's detail page shows a red panel under the header with:
- Happened at — the time of the validator log line the verdict came from.
- Impact — what the verdict does to the node (
Score set to 0,New rentals are disabled …,Unrented incentive withheld …). - How to fix — the validator's remediation text for that reason code.
- Technical details — the
what_we_sawpayload: the raw numbers behind the verdict, for exampleema_verifyx_download_speedandmin_download_speed_mbpsfor a network failure, or the container name for an orphaned rental container. - Copy for Discord (top right) — copies the hotkey, node id, error message, job batch id and technical details in the format the support flow asks for.
Performance Monitoring
Key Performance Indicators (KPIs)
Track these metrics to optimize your node performance:
1. Uptime Metrics
- Active Time: Time the node has been active in the system
- Availability: Percentage of time the node is online and operational
2. Rental Price
- Current Rate: Your current rental price per hour
- Market Position: How your pricing compares to similar nodes
Real-time emission and validator scores
The Earnings Dashboard displays settled emission per subnet epoch, including an hourly breakdown on a node's day page, and links each settled epoch to its on-chain proof. For live emission ahead of settlement, check the external TaoMarketCap → Subnet 51 for your hotkey.
For real-time validator scoring (the upstream input to emission), Lium exposes a Grafana dashboard suite that providers can read directly. The same dashboards are embedded inside the Provider Portal on each node's detail page (the Grafana tab) — that's where you'll see the synthetic-job and scoring telemetry without leaving the portal. Use the Earnings Dashboard for the resulting settled emission and the embedded Grafana for the validator-side score signals that produce it.
Node alerts
The portal notifies you about events on your nodes, rentals, penalties and payouts: every one lands in the portal inbox (the bell at the bottom of the sidebar), while e-mail, Discord direct messages and signed HTTPS webhooks are available when you enable them. The Status badge above and the Grafana dashboards stay the place to watch live state; alerts tell you when something changed.
What is sent
| Event | Alert title | Fires when | Severity |
|---|---|---|---|
| Node offline | Node offline | a node fails three health checks in a row (within six hours), or the validator has stopped updating it | critical |
| Validation failed | Node validation failed | a verified node that answers health checks fails two validation cycles in a row for the same reason (within 45 minutes) | critical |
| Node inactive | Node inactive | a node is set inactive because its reported GPU model, GPU count or installed GPUs changed | critical |
| Node listed | Node listed | a node you added becomes visible to renters for the first time (within 30 days of adding it); once per node | info |
| Rental interrupted | Rental interrupted | a secure rental on your node was interrupted and the interruption penalty was applied | critical |
| Penalty applied | Provider penalty applied | any other provider penalty was applied | critical |
| Payout sent | Provider payout sent | a payout was sent to your coldkey | info |
The event name is the switch under Profile → Notifications; the alert title is what the inbox, the Discord message, the e-mail subject (after [Lium]) and the webhook title field show. A penalty produces exactly one of Rental interrupted or Penalty applied, never both. When more than 50 nodes across all providers go stale in one sweep, each provider with two or more stale nodes in that sweep receives one Nodes offline alert (inbox and push) with the affected node count; a provider with one stale node receives the usual Node offline alert.
Channels and defaults
- Inbox — always on. Open the bell to read alerts, follow the link to the node or the earnings day, and mark them read. The inbox does not depend on the push settings below.
- E-mail — off until you enable it under Profile → Notifications; you can turn it on once your e-mail address is confirmed (the e-mail address on your Profile page; open the link mailed to it). Nothing is mailed to an address that is not confirmed, or after the address is changed until the new link is opened. Each mail has the subject
[Lium] <alert title>, the alert's details, a button to the node or earnings day in the portal, and a plain-text version for mail apps that do not show HTML. - Discord direct messages — off until you enable them under Profile → Notifications. Your account must have a linked Discord, and your Discord privacy settings must allow direct messages from members of the Lium server. If the bot cannot reach you, the portal says so and you can reconnect Discord after changing the setting.
- Webhook — off until you enable it. Configure an endpoint first (below), then turn on Webhook push.
- Per-event switches — each event can be turned off for your account under Profile → Notifications; an event that is off is not pushed anywhere, though it still appears in the inbox.
Setting up a webhook
- Under Profile → Notifications, enter an
https://URL on a public host. The portal refuseshttp://, URLs with embedded credentials, and hosts that resolve to private, loopback or otherwise reserved addresses; redirects are not followed. - Saving a new URL shows a signing secret once — copy it. Rotate secret issues a new one and invalidates the old one.
- Press Send test to receive a test delivery (up to five tests per minute per account), then turn on Webhook push.
Each delivery is a POST with Content-Type: application/json, User-Agent: Lium-Notifications/1.0 and two headers to verify:
X-Lium-Timestamp— Unix seconds at send time.X-Lium-Signature—sha256=<hex>, where hex isHMAC-SHA256(secret, "<X-Lium-Timestamp>.<raw request body>"). Compute it over the raw bytes you received, not over re-serialized JSON, and compare with a constant-time comparison.
import hashlib, hmac, time

def verify(secret: str, timestamp: str, raw_body: bytes, signature: str) -> bool:
    try:
        if abs(time.time() - int(timestamp)) > 300:
            return False
    except ValueError:
        return False
    expected = "sha256=" + hmac.new(secret.encode(), timestamp.encode() + b"." + raw_body, hashlib.sha256).hexdigest()
    return hmac.compare_digest(expected, signature)
The body is one JSON object:
{
  "id": "0d6c…",
  "event": "node.offline",
  "created_at": "2026-09-22T15:04:11+00:00",
  "severity": "critical",
  "title": "Node offline",
  "body": "…",
  "payload": { "…": "event fields, per type" },
  "resource": { "type": "node", "id": "…" }
}
Reject deliveries whose timestamp is more than five minutes from your server's clock. id is stable across retries — deduplicate on it before processing. resource is null for events that are not about one node.
Retries and auto-disable. Your endpoint has 10 seconds to answer. A 2xx counts as delivered. A 429 or 5xx, a timeout or a connection error is retried up to four times, about 1 minute, 5 minutes, 30 minutes and 2 hours later. Any other status is final for that alert. After 12 alerts in a row that could not be delivered, Webhook push is switched off and Profile → Notifications shows the last failure and its time; fix the endpoint and turn Webhook push back on — that resets the counter. Saving a new URL or rotating the secret resets it as well.
Discord and e-mail retries. A direct message that Discord rate-limits or fails to accept, and an alert mail the mail service fails to accept, are retried about 30 seconds, 2 minutes and 10 minutes later (Discord's own retry_after is honored up to 5 minutes). If Discord reports that your account does not accept direct messages from the bot, the channel is paused for your account until you reconnect Discord.
Delivery is at-least-once: in the rare case a worker stops between sending an alert and recording it, the same alert can be pushed a second time. Webhook receivers should treat a repeated id as already seen; a Discord message or an alert mail may repeat in that window.
Reading the verification timeline
Every validator cycle (about every 15 minutes, on a fixed grid) runs the same ordered list of checks on your node — upload, hardware scan, duplicate check, port checks, the VerifyX bandwidth and GPU proof, the GPU benchmark, the rental check, scoring. The node page's Verification panel, GET /executors/{id}/verification on the portal API and the CLI view, lium provider node status <node-id> (also lium mine status <node-id>), show where a run is:
- verifying · step 3/6 Bandwidth & GPU proof · 42 s elapsed · ~70 s left — the validator reported the start of a run for this node and the checks should still be going. The step and the time left are estimates: elapsed time walked along the typical duration of each step in this node's last runs (the fleet's typical durations while the node has fewer than three of its own). The panel says which history it used. Steps before the running one are shown as done; they are inferred from time, not measured.
- checks done · waiting for the validator to publish the result — the node's own checks should be over. The verdict appears only when the validator publishes the whole cycle, which happens after every provider in the cycle has been checked and scored — typically a few minutes after the node's own run ends. The panel shows when the last result landed relative to its cycle, and estimates this one from it.
- idle · last run passed in 2 min 40 s — between runs. The timeline lists the steps of the last run with ✓/✗ and how long each took; only steps that took a second or more are listed, the rest are sub-second bookkeeping. A failed run shows ✗ on the step that stopped it and the reason code; steps after it never ran. The next cycle time is shown from the grid.
- not verified yet — the validator has never reported on this node. The first check starts with the next cycle; expect
Add Node → AVAILABLEto take about 20 minutes at the median (see What each status means).
The CLI view adds --watch (refreshing every 5 s) and --json with the same fields as GET /executors/{id}/verification (phase, current, elapsed_s, eta_s, basis, steps[], run, last_run, next_check_expected_at).
Monitoring Tools
1. Node Details Page
Access comprehensive node information:
- Navigate to Node: Go to
https://provider.lium.io/executors/{executor-id} - Review Status: Check all status indicators
- Monitor Performance: Track key metrics
Network speed
The Specifications panel shows one pair of network figures, Network Upload/Download, in Mbps, and the label says where they come from:
- (measured) — a figure the platform checked or averaged: the average of the node's VerifyX checks over cycles when it has one, else the average of its speed tests over cycles, else (download only) a single VerifyX download. This is the number renters see and filter on in Browse Pods and
lium ls, and the number that decides the slow-node flag (under 100 Mbps download). When the node's latest speed-test sample says something else, that sample is kept underneath as Latest speed-test sample on the node. - (reported) — nothing has been checked or averaged for the node yet, so the panel shows the single speed-test sample the node produced. It becomes measured after the next validator cycle that averages or VerifyX-checks the network.
- (upload reported, download measured) — the two directions come from different places (a VerifyX download is checked before any upload average exists), so each carries its own word.
A node with no figure of either kind shows dashes and no label, never 0. Figures are whole Mbps with the fraction dropped, the same as lium ls. The VerifyX average is also the figure behind a VERIFYX_FAILED_NETWORK_SPEED_TOO_SLOW verdict in the last-error panel (see Troubleshooting → VerifyX).
Idle Pay Tier
The General panel shows the node's idle-pay tier next to its Secure or Spot tier: the GPU model and count, the tier's shared cap, how many GPUs are idle in it now, and the share the tier pays when it is over its cap. The numbers come from the same table as the rewards calculator. A Spot node shows "None": it is in no idle-pay tier. A node you set to Spot yourself is paid idle only while a Lium Default Job runs on it (see Idle pay on Spot); every node of a demoted account is rated as Spot and earns rental income and the same Spot idle pay while the demotion lasts. A node with every GPU rented shows its tier and says it earns rental income and no idle pay right now. A node whose New Rentals setting is Paused shows its tier and says it earns no idle pay until new rentals resume. A node that splits and has some GPUs rented shows its split tier: the rented GPUs earn rental income and the free GPUs are paid from the split tier, whatever the node's own tier says, while split-node scoring is on (it is on by default; with it off the whole node counts as rented and earns no idle pay). A node with 2 or 4 GPUs shows that the table has 1-GPU and 8-GPU tiers only. A GPU model with no open tier shows that too: the tier pays nothing right now. The GPU model is matched to a tier by the validator's exact model list, so an RTX 3090 Ti is not an RTX 3090 and an RTX 4090 D is an RTX 4090. A node that splits below its GPU count gets one more line. If its own count has no tier, the line says the node is rated in its split tier. Otherwise it says the validator moves the node there only when its own tier is over the cap and all of the node's GPUs fit under the smaller tier's cap, and whether the node fits today. See Rewards FAQ 8.
Public listing
The Public listing line under the Status says whether the public listing (the marketplace on lium.io, GET https://lium.io/api/executors and its live feed) carries the node now. The listing itself drops a node without a reason, so this line is where you read one:
- Listed: renters can see and rent the node's free GPUs.
- Rented since a time: a renter holds the node and none of it is offered to another renter. The time is the start of the oldest rental on the node.
- Hidden from renters: the node is free, but a listing condition fails. Each failing condition is shown under the line.
- Offline: the node does not answer the platform's ping, or the validator has not checked it recently.
- Validating: the node waits for its first or next validator check.
GET /executors/listing on the portal API, signed in, returns every node of your account at once: listing_state (rented, listed, hidden, offline or validating), hidden_reasons (a code and a message for each failing condition), gpu_count, rented_gpu_count, rented_since, computed_status, and new_rentals_pause_requested_at and pause_id (see Pausing New Rentals). GET /executors and GET /executors/{id} carry listing_state, hidden_reasons and rented_since with each node.
| Code | The listing condition that fails |
|---|---|
NEW_RENTALS_PAUSED | Pause New Rentals is on. |
RECLAIMING | The node carries a collateral-reclaim flag. |
NOT_RESPONDING | The ping of the node's service port failed. |
NOT_ACTIVE | The validator has not activated the node; the message is the node's Status sentence. |
NOT_VERIFIED | The validator has not verified the node. |
GPU_COUNT_UNKNOWN | The validator has not reported the node's GPU count. |
DISK_NOT_REPORTED, DISK_TOO_FULL, DISK_FREE_TOO_LOW | The disk must report its usage, be at most 90% used and have at least 100 GB free. |
INSUFFICIENT_PORTS | Fewer than 3 verified free ports. |
NETWORK_TOO_SLOW | Download or upload below the listing's speed floor (100 Mbps), or no usable figure for one of them from the latest check. Only while the listing filters by speed. |
SPLIT_MINIMUM_NOT_MET, WHOLE_HOST_ONLY | A partly rented node's free GPUs are not offered: GPU splitting is off or its minimum is above the free count, or the host keeps GPU profiling counters open and rents only whole. |
| Any other code | A problem the platform or the validator recorded on the node, such as EXECUTOR_SSH_UNREACHABLE; see The last error panel. |
2. Grafana Integration
Access detailed monitoring dashboards:
- Access Grafana: Click the "Grafana" tab on your node details page
- View Dashboards: Access comprehensive monitoring dashboards
- Analyze Metrics: Review detailed performance data
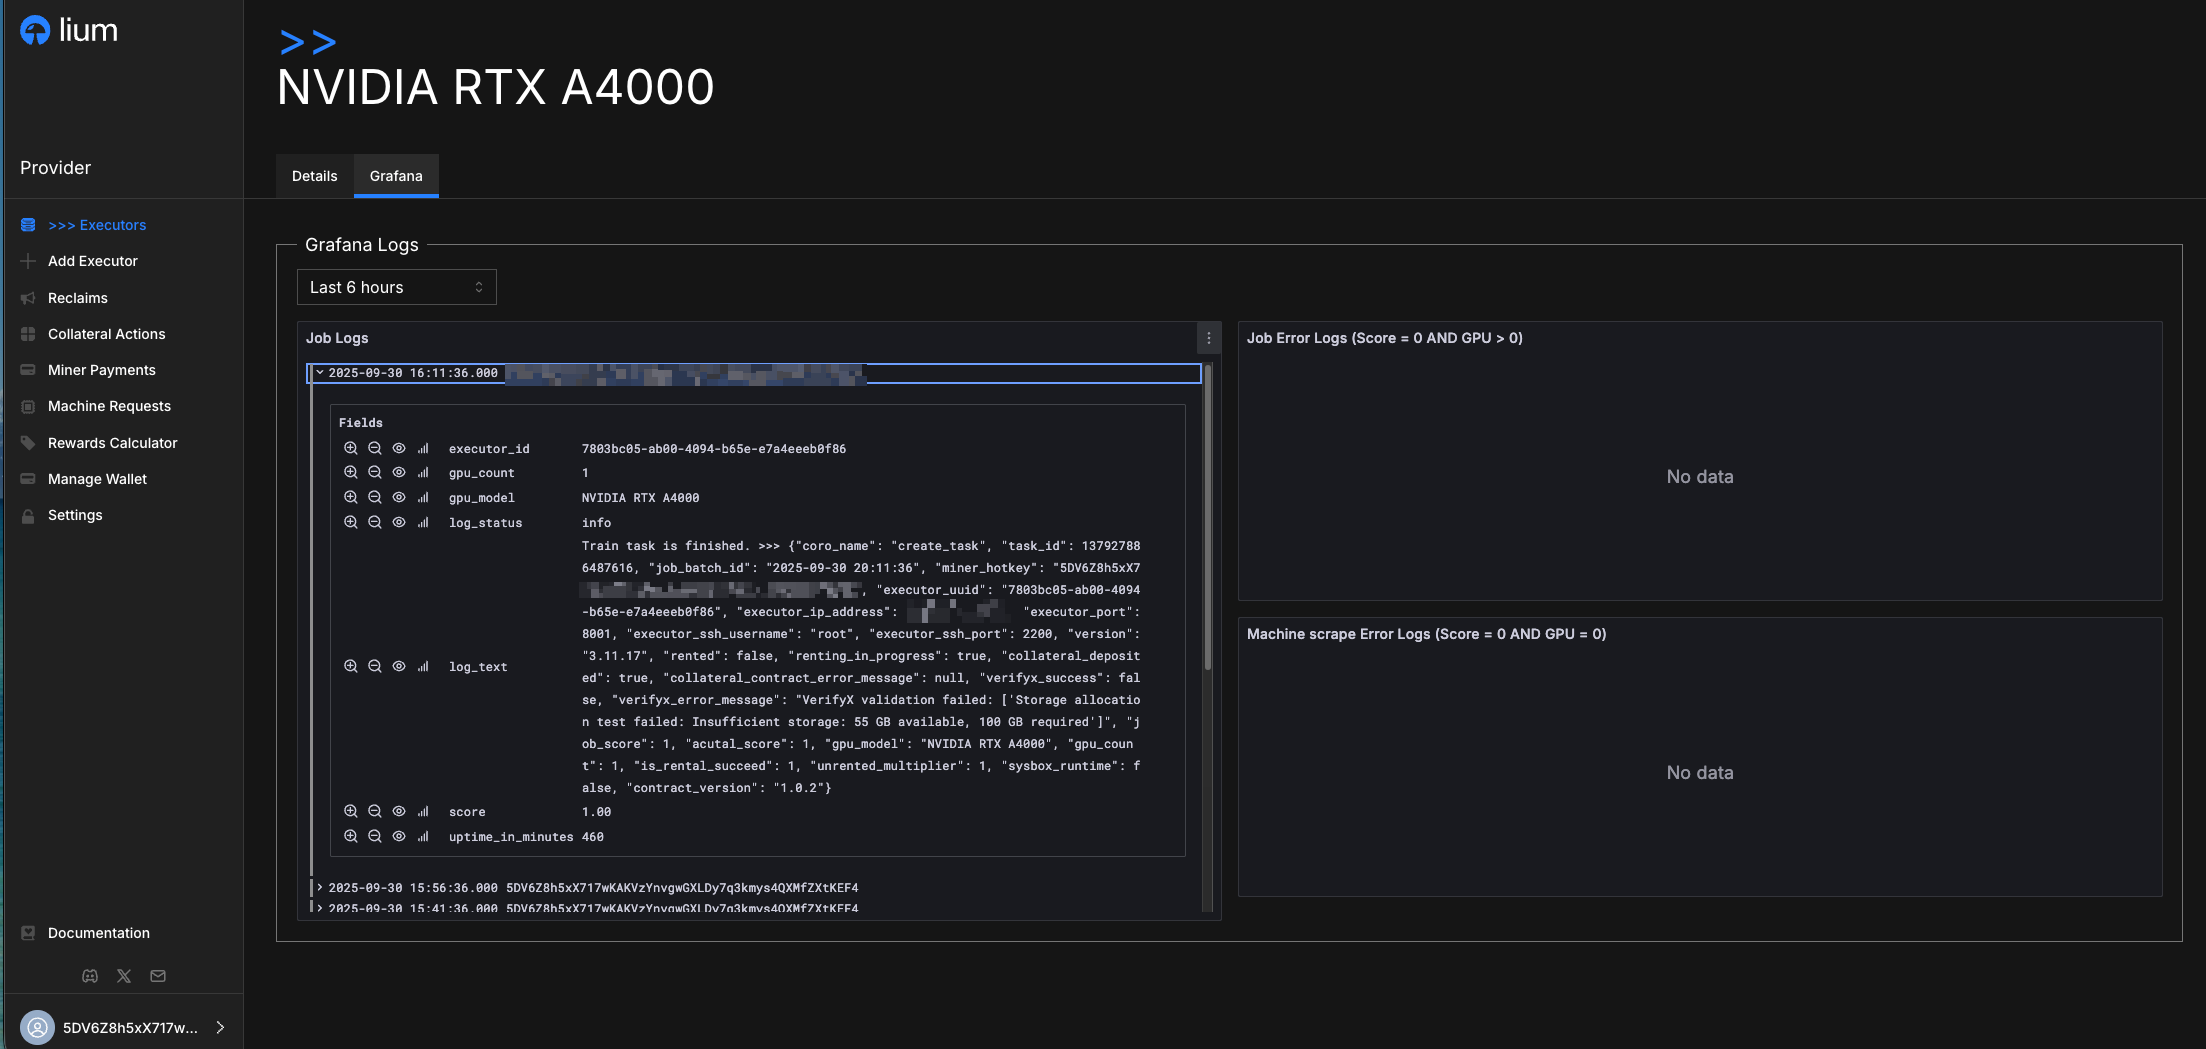
The Grafana integration provides real-time monitoring of all synthetic jobs.
Troubleshooting
- A badge other than AVAILABLE / RENTED: start with What each status means above, then the reason code in Validator reason codes.
- Low rental activity on an AVAILABLE node: review the price against the market median shown on the node page and the price limits; a node that is often OFFLINE or VALIDATION FAILED is hidden from renters for those periods.