Monitoring Nodes
This guide covers monitoring your nodes, including status tracking and performance metrics.
Overview
Monitor your nodes to ensure optimal performance and maximize earnings:
- Status Monitoring: Track node health and availability
- Performance Metrics: Monitor key performance indicators
- Grafana Integration: Access detailed logs and dashboards
Node Status Monitoring
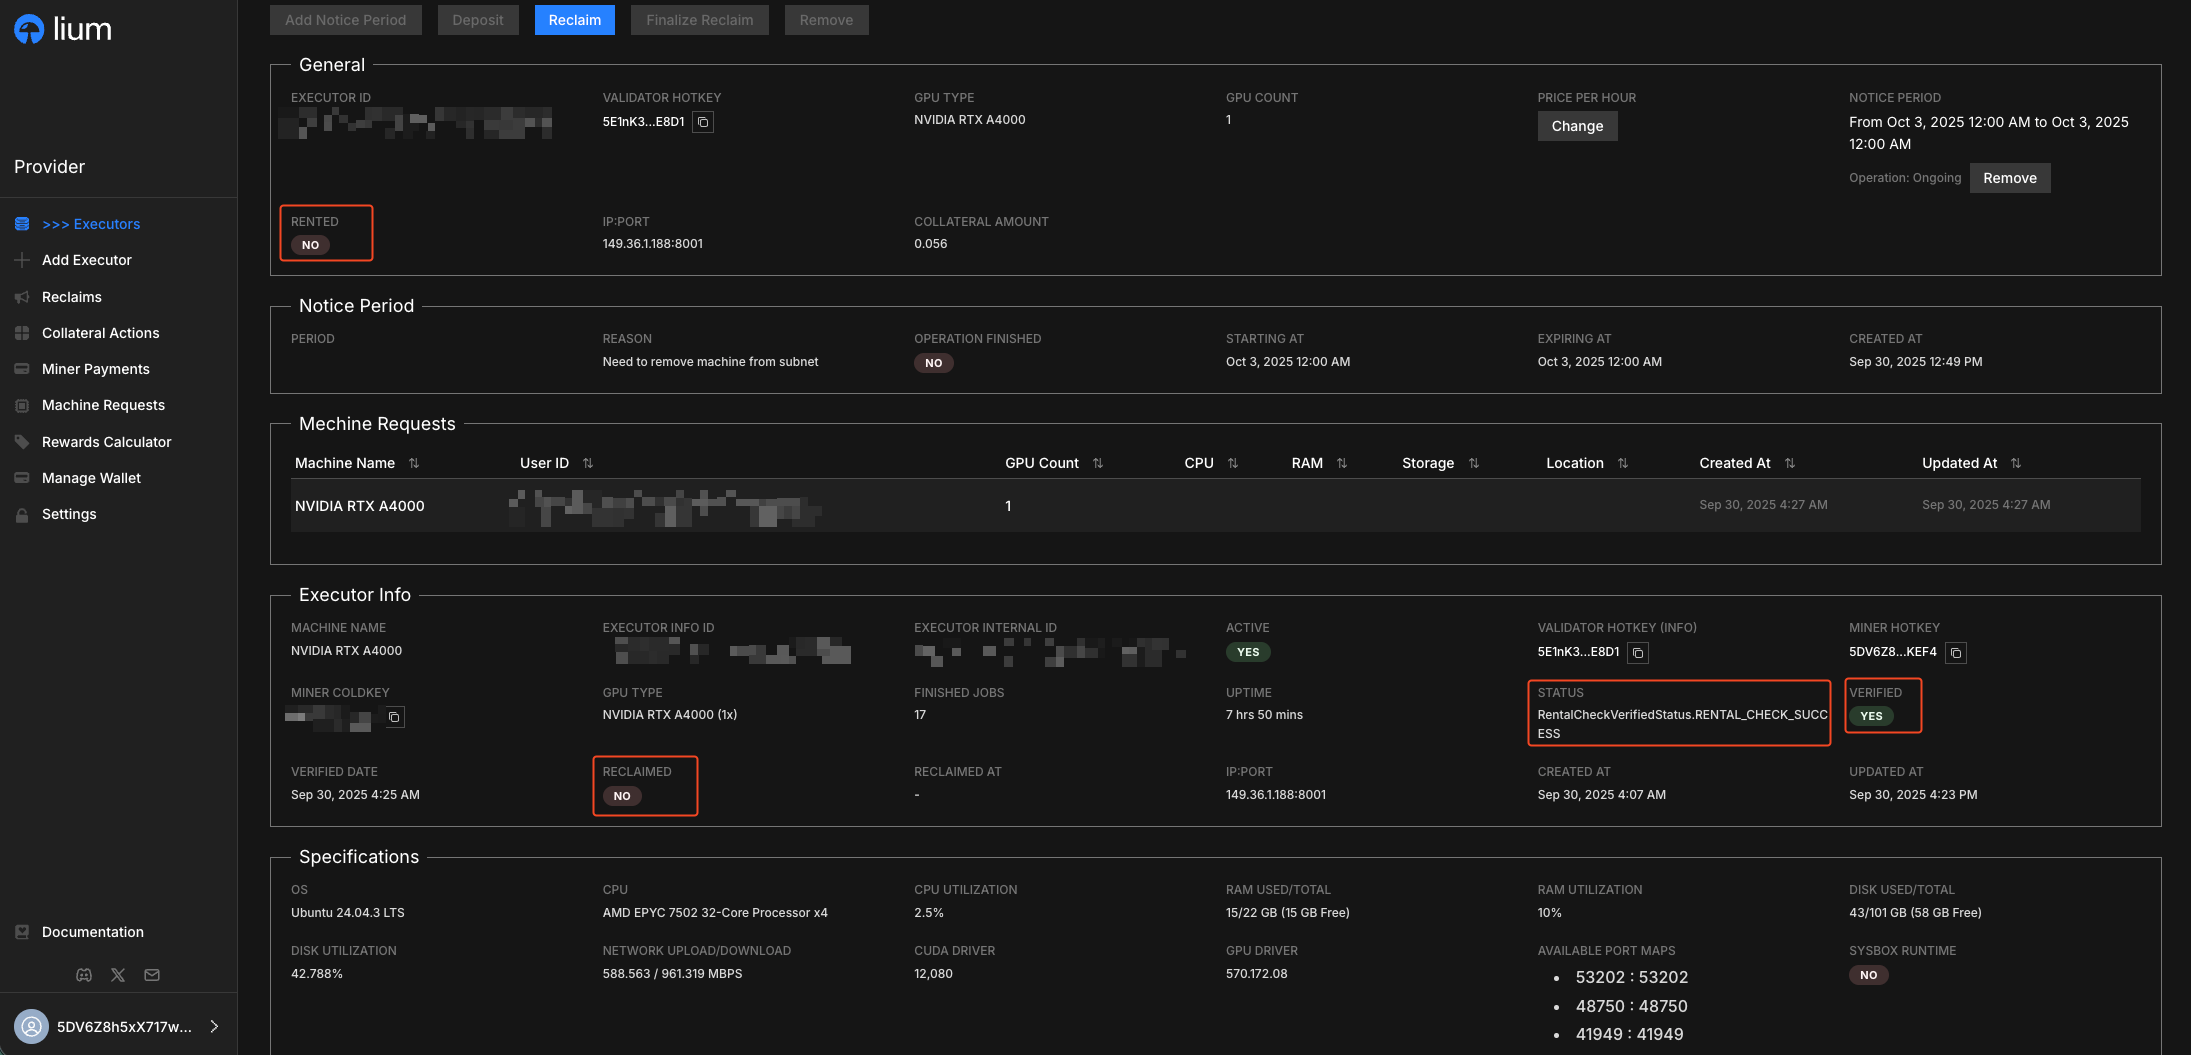
Primary Status Indicators
Monitor these key status indicators to ensure your nodes are operating correctly:
1. Rental Check Status
The rental check status indicates the verification state of your node:
-
RENTAL_CHECK_SUCCESS: ✅ Rental verification completed successfully
- Node is properly configured and ready for rentals
- All system checks have passed
-
RENTAL_CHECK_FAILED: ❌ Rental verification failed due to issues
- Configuration problems detected
- Network connectivity issues
- Hardware or software problems
-
RENTAL_CHECK_PENDING: ⏳ Rental verification is queued for processing
- Verification request submitted
- Waiting for system processing
-
RENTAL_CHECK_IN_PROGRESS: 🔄 Rental verification is currently being performed
- System is actively testing the node
- Verification process in progress
- Wait for completion before taking action
2. Active Status
Indicates whether the machine is currently operational:
- Yes: ✅ Machine is running and available for rental
- No: ❌ Machine is offline or not responding
3. Rent Status
Shows the rented status:
- Yes: 🟢 Machine is already rented by customer
- No: 🔴 Machine is not rented yet
Performance Monitoring
Key Performance Indicators (KPIs)
Track these metrics to optimize your node performance:
1. Uptime Metrics
- Active Time: Time the node has been active in the system
- Availability: Percentage of time the node is online and operational
2. Rental Price
- Current Rate: Your current rental price per hour
- Market Position: How your pricing compares to similar nodes
Monitoring Tools
1. Node Details Page
Access comprehensive node information:
- Navigate to Node: Go to
https://provider.lium.io/executors/{executor-id} - Review Status: Check all status indicators
- Monitor Performance: Track key metrics
2. Grafana Integration
Access detailed monitoring dashboards:
- Access Grafana: Click the "Grafana" tab on your node details page
- View Dashboards: Access comprehensive monitoring dashboards
- Analyze Metrics: Review detailed performance data
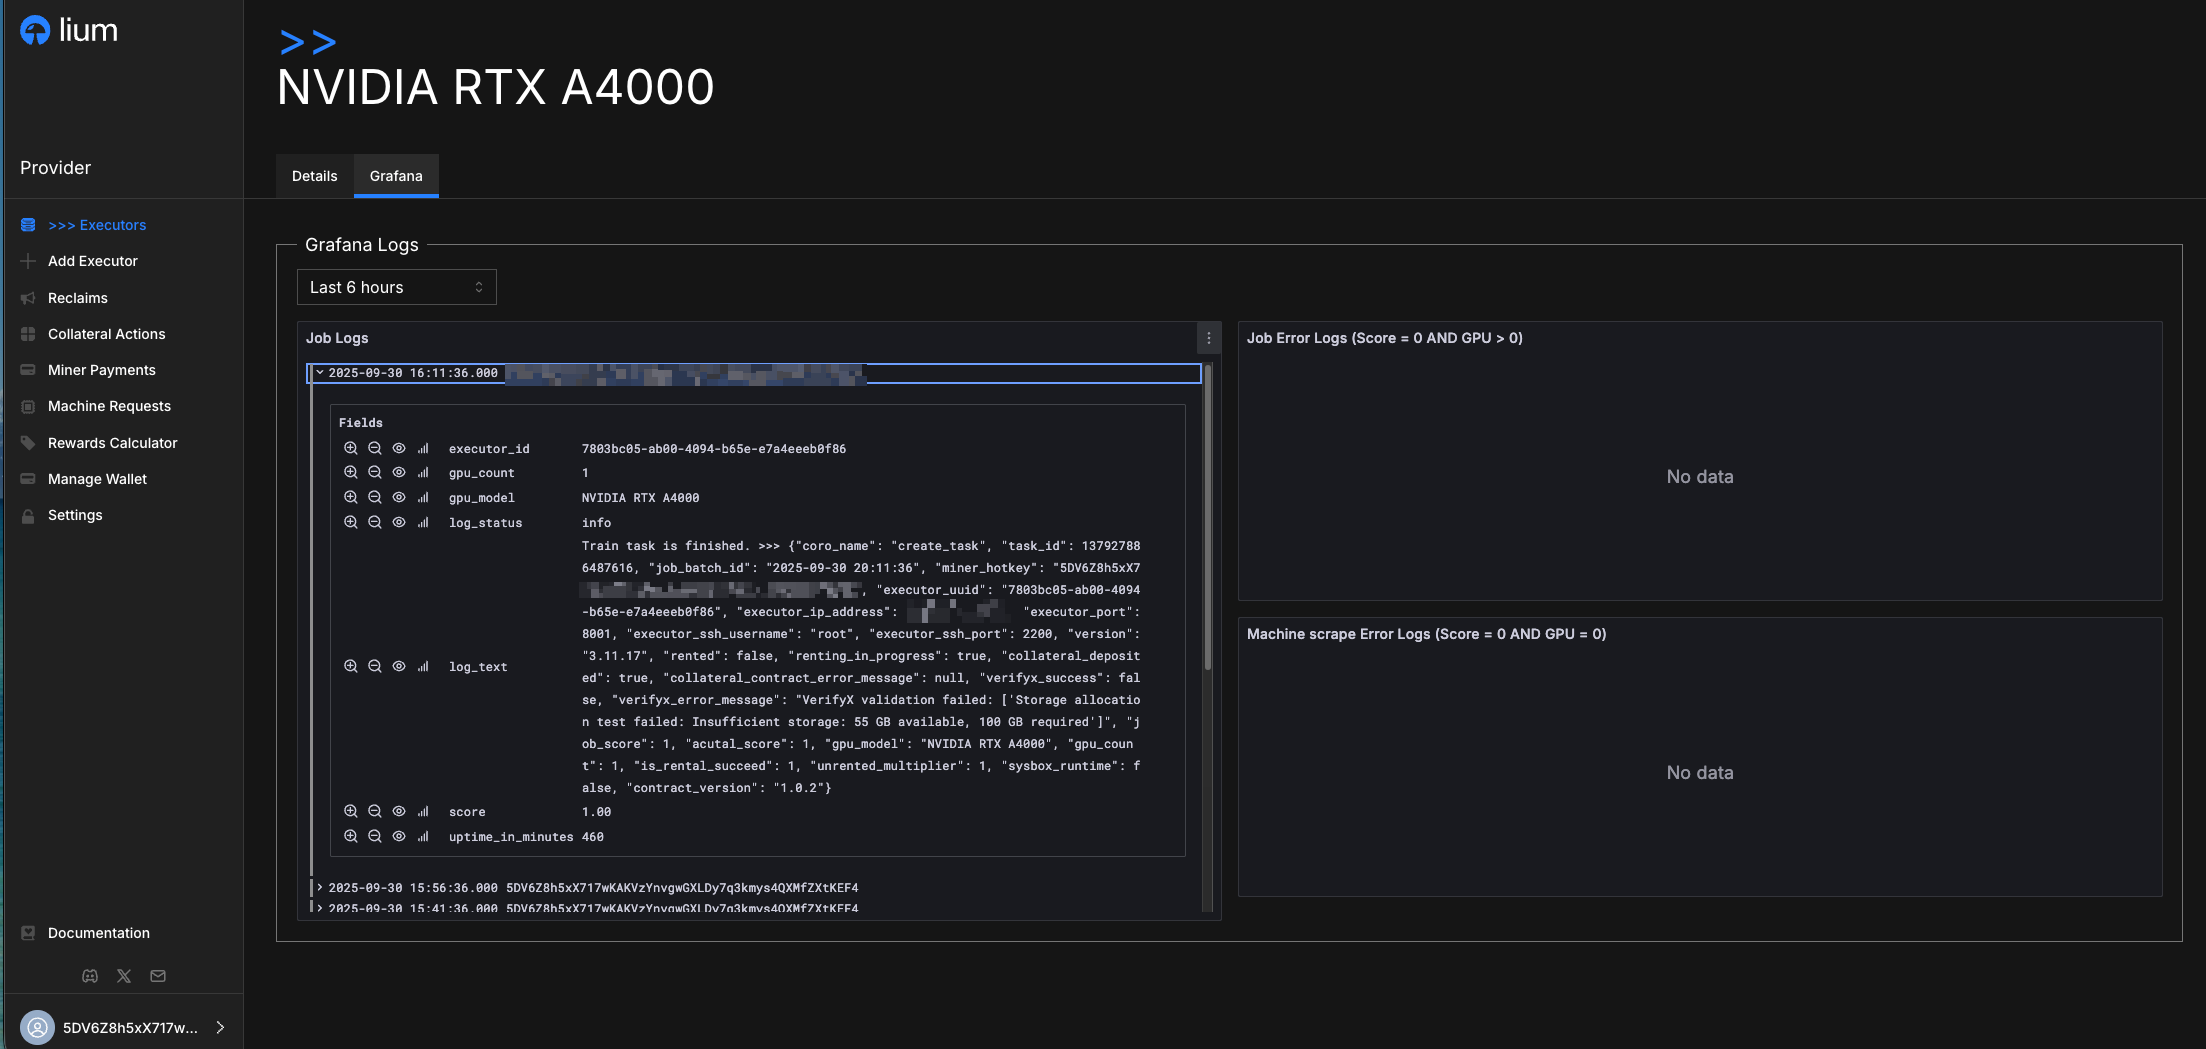
The Grafana integration provides real-time monitoring of all synthetic jobs.
Troubleshooting
Common Issues
Rental Check Failed
- Check Network: Ensure stable internet connection
- Verify Software: Confirm node software is running
- Review Configuration: Check all settings are correct
Inactive Status
- Check Services: Verify node software is running
- Network Issues: Test connectivity and firewall settings
- Hardware: Ensure all hardware components are functioning
Low Rental Activity
- Pricing: Review and adjust your rental rates
- Availability: Ensure node is consistently online
- Performance: Monitor and improve execution quality